Custom Dashboards
Ask Vero for the analytics you want and get a dashboard for a repository or monitor that stays up to date.
The built-in analytics answer the usual questions. When you want a different view, such as labels per folder next to labeling progress, or defects per shift for one monitor, ask Vero to build a dashboard for it. The dashboard lives on the repository's or monitor's analytics page, next to the built-in one.
A custom dashboard reads your data every time it opens, so its numbers are always current. It isn't a picture of the day it was made.
Create a dashboard for a repository
- Open the repository and its Analytics tab.
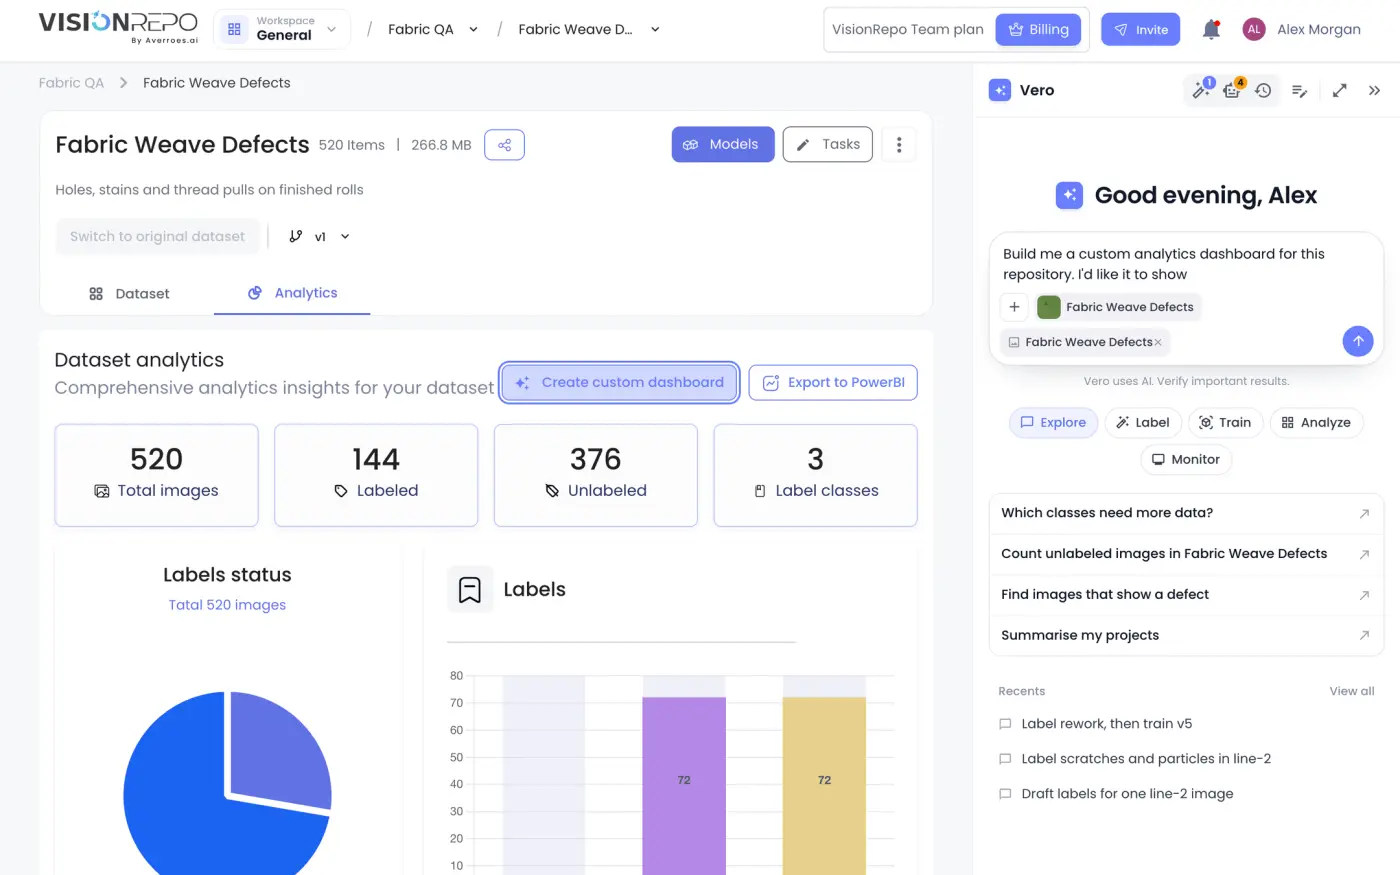
- Click Create custom dashboard, next to Export to PowerBI. Vero opens with a request about this repository in the message box, ending in I'd like it to show.
- Finish the sentence with what you want to see, for example labels per class, labeled vs unlabeled per folder, and the AI labels still waiting for review, and send it.
Once the repository has a dashboard, the Analytics tab gets a Built-in / Custom switch at the top. Custom shows the dashboard.
You can also just ask Vero from anywhere, such as Build an analytics dashboard for Wafer Surface Defects showing defects per folder. The Analyze chip on Vero's welcome screen has the same request.
While Vero works, its steps include Building the dashboard. This can take a minute or two. When it's done, Vero replies with a link to the dashboard.
Create a dashboard for a monitor
On a monitor's analytics page, click Create custom dashboard in the bar at the top, and finish the request the same way. The result appears under the Custom tab, beside the built-in sections. Until there is one, that tab reads No custom dashboard yet and has the same button. See Monitor Analytics.
Dashboards are only for repositories and monitors. If you ask for one about something else, such as a model, Vero builds it for the repository or monitor behind it, or answers with a chart in the chat instead.
Use a dashboard
Switch to Custom to see it. The top shows its name and a one-line description.
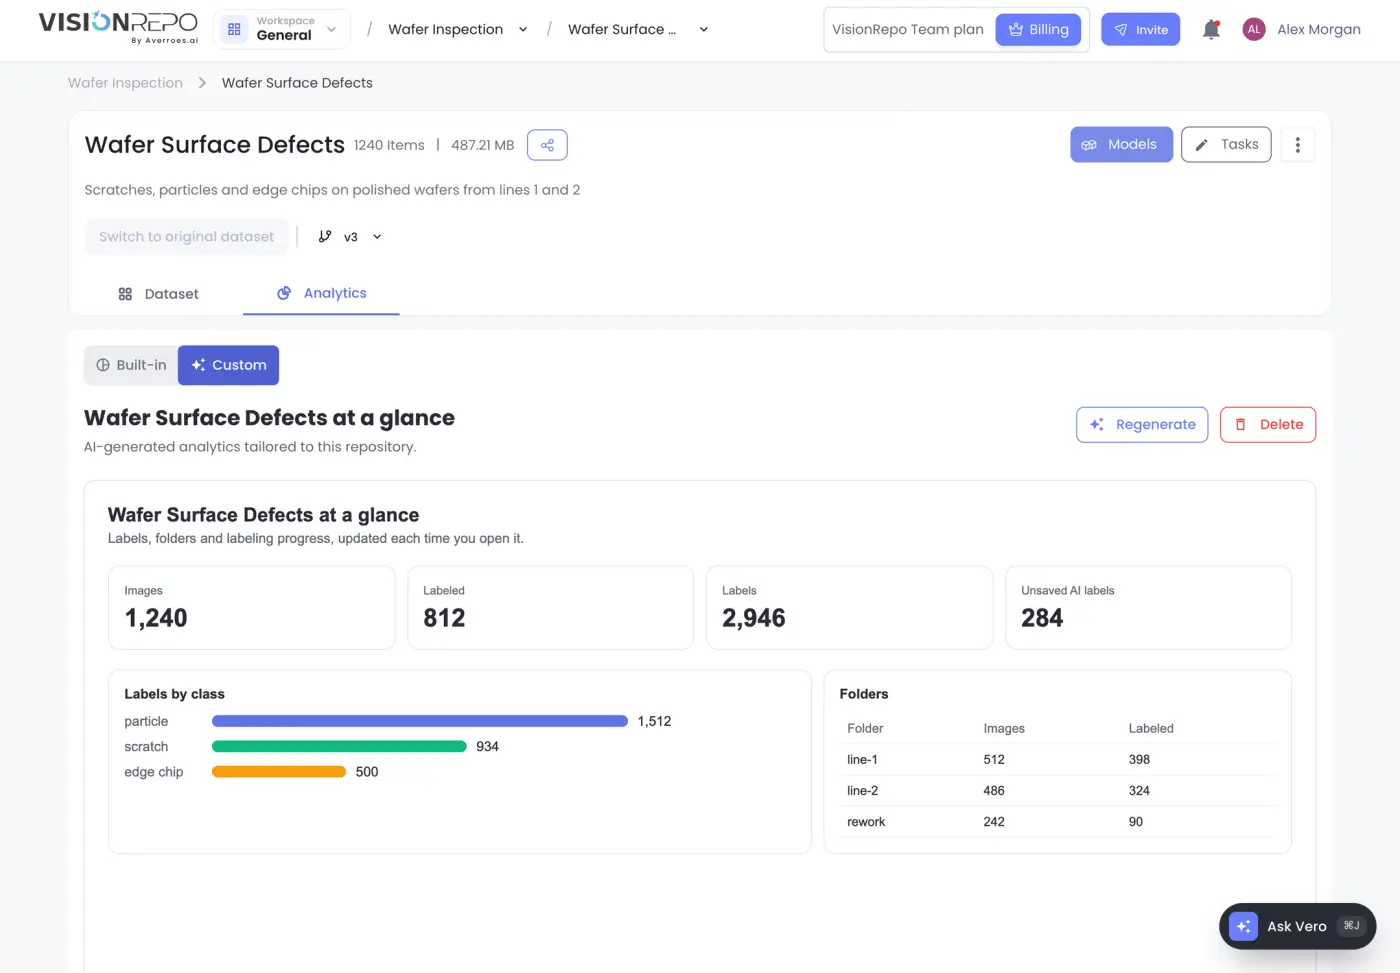
A dashboard can have its own filters and a refresh button, depending on what you asked for. It shows data as your account sees it. Links in it open in a new tab.
Change or replace a dashboard
Each repository and monitor has one custom dashboard.
- Regenerate opens Vero with a request to rebuild this dashboard. Say what to change, such as add a chart of labels per day, and send it. The new dashboard replaces the old one.
- Asking Vero to change the dashboard in a chat does the same.
- Delete removes the dashboard after you confirm (Delete dashboard). You can ask Vero for a new one at any time.
Charts in the chat instead
For a quick look, you don't need a dashboard: ask Vero for a chart, such as Show the class balance as a chart, and it draws one in its reply. Those charts are a snapshot of the numbers at that moment and don't update. Use a dashboard for anything you'll want to look at again.
Share what a dashboard shows
To have numbers like these emailed to you on a schedule, ask Vero for an agent instead, or click Create an agent on a monitor's analytics page. See Vero Agents.
To share what a dashboard shows with someone outside the app, ask Vero for a summary in the chat and copy it with Copy reply.