Repository Details and Versions
Find your way around a repository's page, work in a draft, save and switch versions, share the repository and read its analytics.
Opening a repository shows its media, its analytics and the controls that act on the whole repository. Everything on the page describes one version of the repository, either as saved or with the unsaved work (the draft) on top.
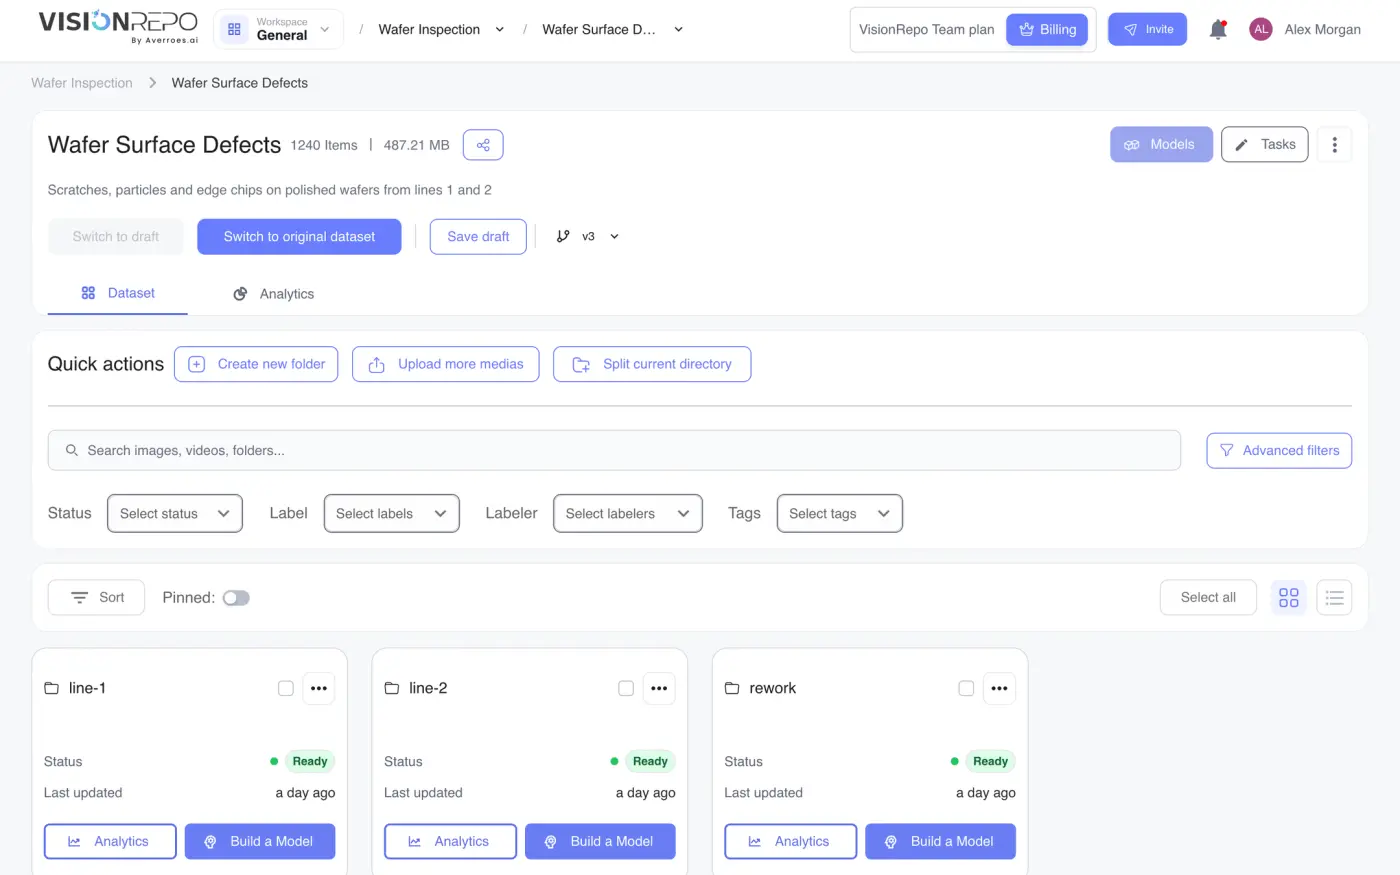
Read the repository header
Across the top, from left to right:
- The repository's name, its item count (such as 1240 Items) and its size on disk. The description, if there is one, sits underneath.
- A share button, which opens Share Repository (see below).
- Build a Model, or Models once the repository has at least one model. Models opens a panel listing the repository's models; a dot on it means a training run finished that you haven't looked at. See Models.
- Tasks, which opens the repository's tasks. See Tasks.
- A three-dot button with Edit Repository, Unit settings, Download and Delete version.
The breadcrumb above the name leads back to the project, and grows a step for each folder you open.
Under the header are the draft and version controls, then two tabs: Dataset, which holds the folders and media, and Analytics.
Understand drafts and versions
A version is a saved snapshot of the repository's media and labels, named V1, V2 and so on. A new repository starts on V1.
When you label images, add or import media, create folders or delete items, the changes collect in a draft on top of the version you're on. The saved version stays exactly as it was until you save the draft as a new version. That's what lets a model point at the exact data it was trained on.
If a version has a draft, the page opens on the draft, since that's where the current work is. Two buttons switch between them:
- Switch to draft shows the version with your unsaved changes.
- Switch to original dataset shows the version as it was saved.
Everything on the page follows the switch: the media grid, the counts and the analytics.
Save a draft as a new version
- Make sure you're looking at the draft.
- Click Save draft.
- In the confirmation, click Save.
The draft becomes the next version and the page moves to it. The version you started from is untouched, so you can always go back to it.
Save draft only appears while you're looking at a draft, and it's disabled if your role can't change media.
Switch versions
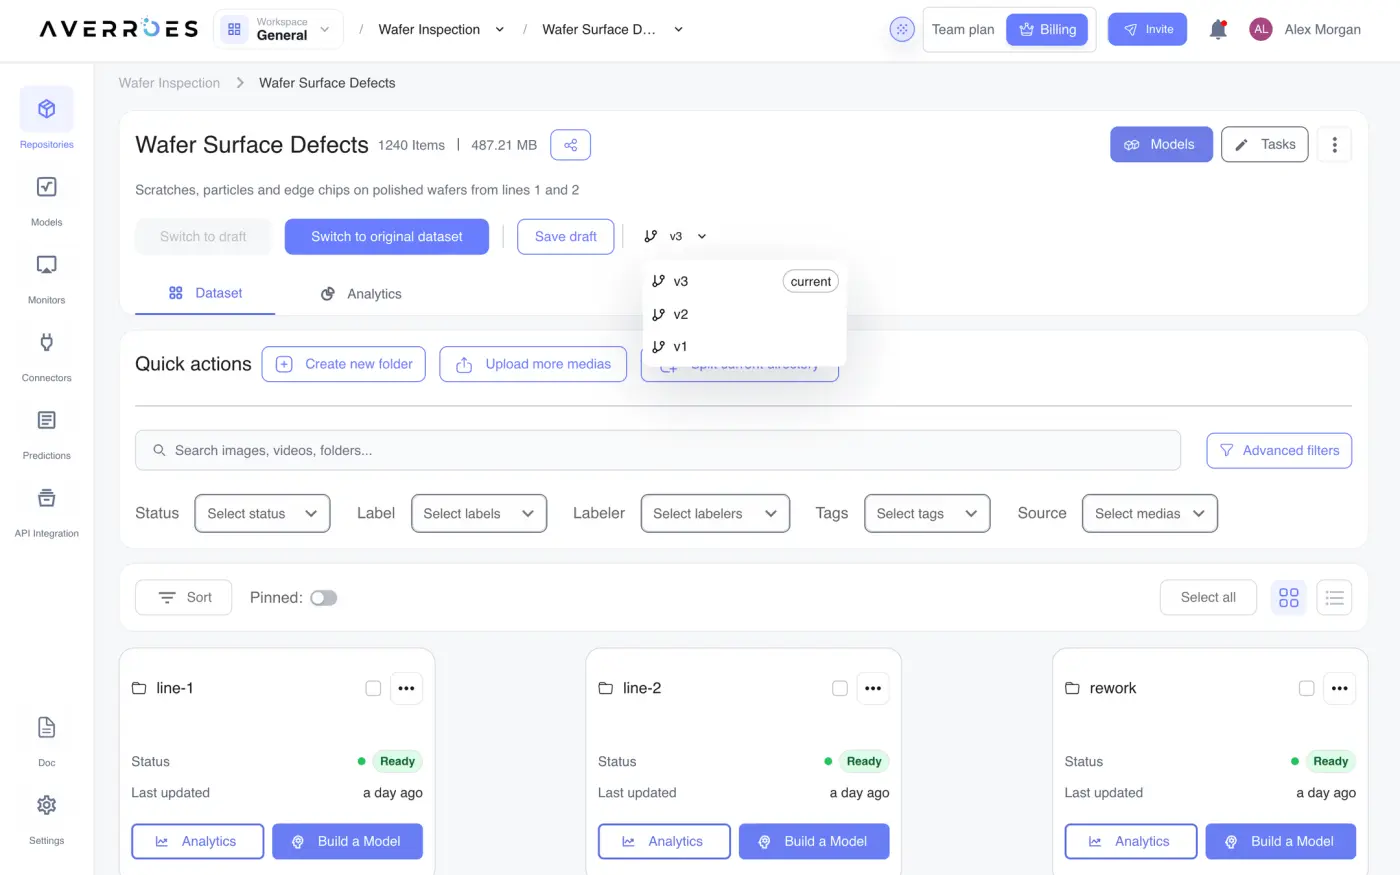
Click the version button (it shows the current version's name, such as V3) to list every version, newest first. The one you're on is tagged current. Pick another to reload the whole page on it.
Delete or restore a version
- Open the three-dot menu and click Delete version.
- Confirm with Delete.
The page moves to the previous version. A deleted version stays in the version list tagged deleted. Open it and the same menu item reads Restore version, which brings it back after you confirm in Restore Dataset Version.
Deleting and restoring versions need permission to change repositories. Without it the item is disabled and hovering it names the missing permission.
Rename the repository
- Open the three-dot menu and click Edit Repository.
- Change Enter a new repository name: and, if you like, Enter repository description:.
- Click Save.
Set a unit for measurements
Measurements on the labeling canvas are in pixels until you tell the repository how big a pixel is.
- Open the three-dot menu and click Unit settings.
- In Update Unit Settings, type a Unit Name, such as
mm(up to 20 characters). - Under Conversion Factor, type how many of that unit one pixel covers, next to 1 px =. For example,
0.26means 1 px = 0.26 mm. The value has to be greater than 0. - Click Save.
Leave this alone if your images don't have a fixed real-world scale.
Download all or part of the repository
Download in the three-dot menu works like the one on the repository card (workspace super admins only, and your plan has to include downloads), with one difference: it asks what to include.
| Option | What it exports |
|---|---|
| All items | The whole repository, with its folder and image counts shown |
| Current folder | Only the folder you're in. Disabled at the top of the repository. |
| Filtered items only | Only what your filters on the Dataset tab match. Disabled until a filter is set (No filters applied) or if nothing matches (No filtered data available). |
Then pick the export type and label format and click Download. You get an email with the link when the export is ready.
Share the repository
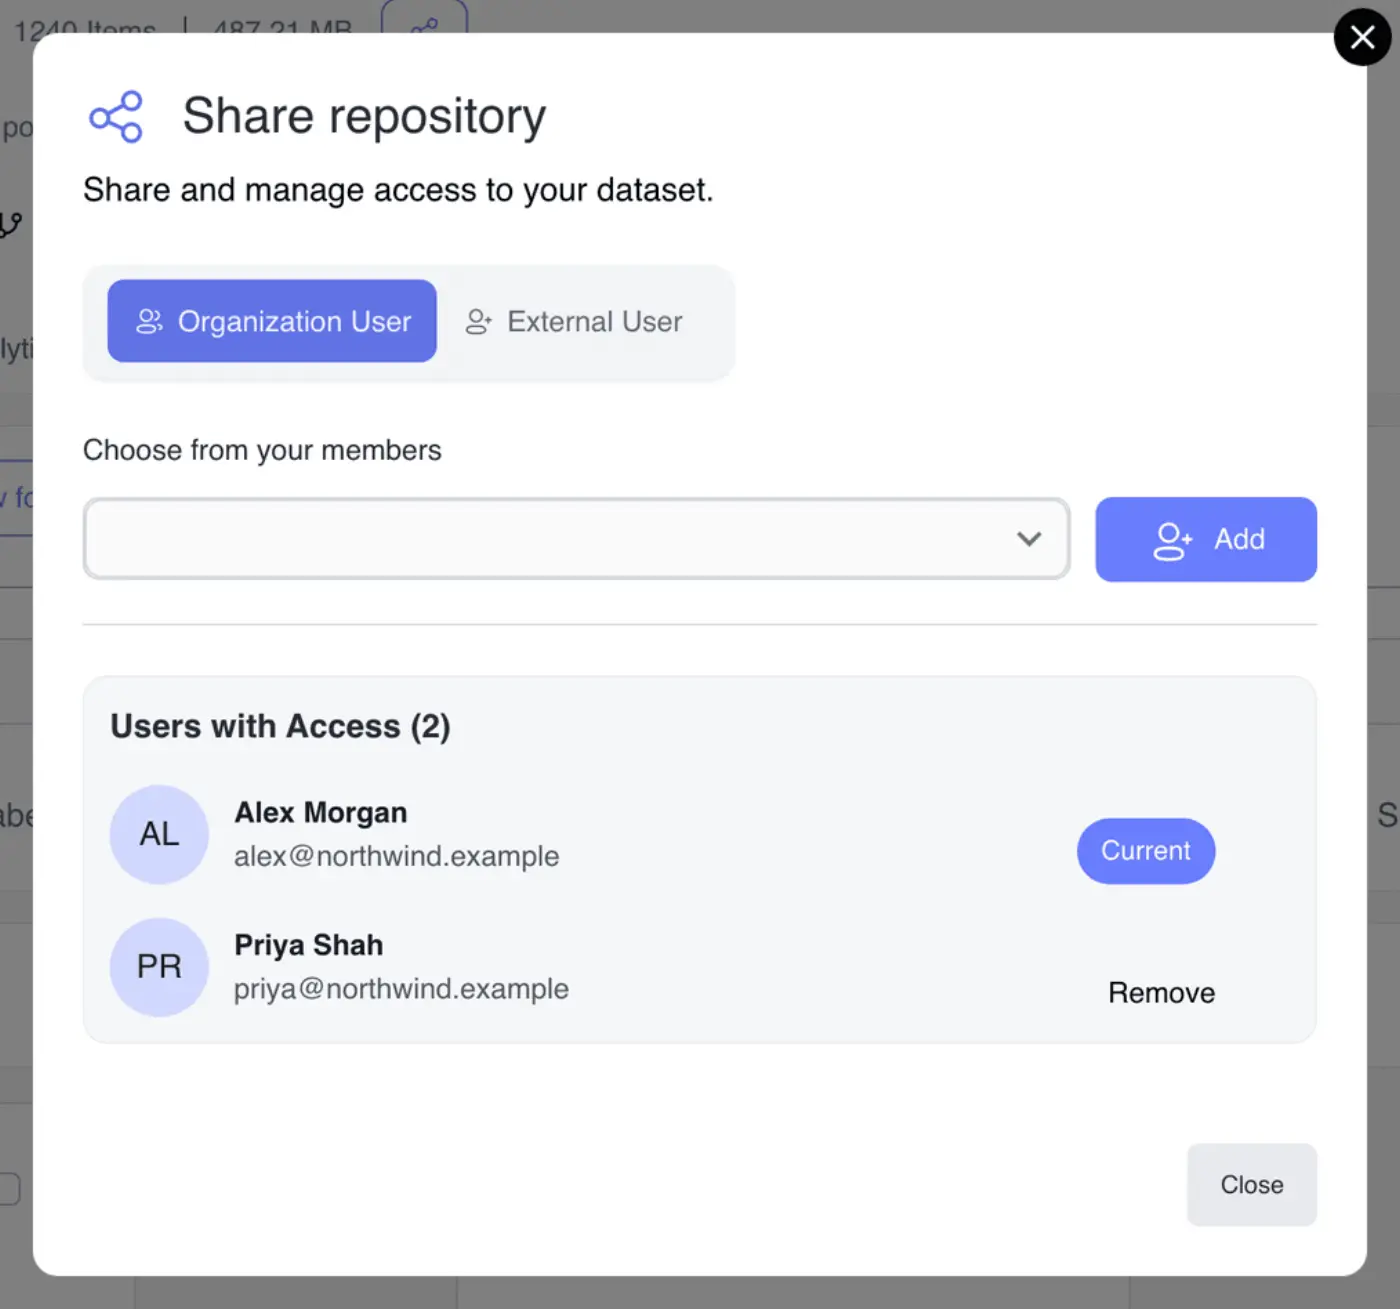
The share button next to the repository's name opens Share Repository. It needs permission to view the workspace's users.
- On Organization User, pick someone under Choose from your members and click Add.
- On External User, type an email address, choose a role and click Invite.
Adding and inviting people also needs permission to manage users. Without it the dialog reads Only administrators can manage dataset access permissions.
Users with Access lists everyone who can open the repository, with Remove beside each person. If adding someone would go over your plan's user allowance, a User limit reached message offers an upgrade.
Read the Analytics tab
The Analytics tab, headed Dataset analytics, opens with four figures: Total images, Labeled, Unlabeled and Label classes. The charts below them are:
| Chart | What it shows |
|---|---|
| Labels status | Labeled against unlabeled images |
| Labels | How many annotations each class has |
| Labels distribution | The size of every annotation, so unusual boxes or shapes stand out. Not shown for classification repositories. |
| Assigned media count (labeling) | How much media is in a labeling task and how much isn't |
| Assigned media count (review) | The same for review tasks |
| Review status | How much of the assigned work has been reviewed |
| Reviewed images per user | Who has reviewed how much |
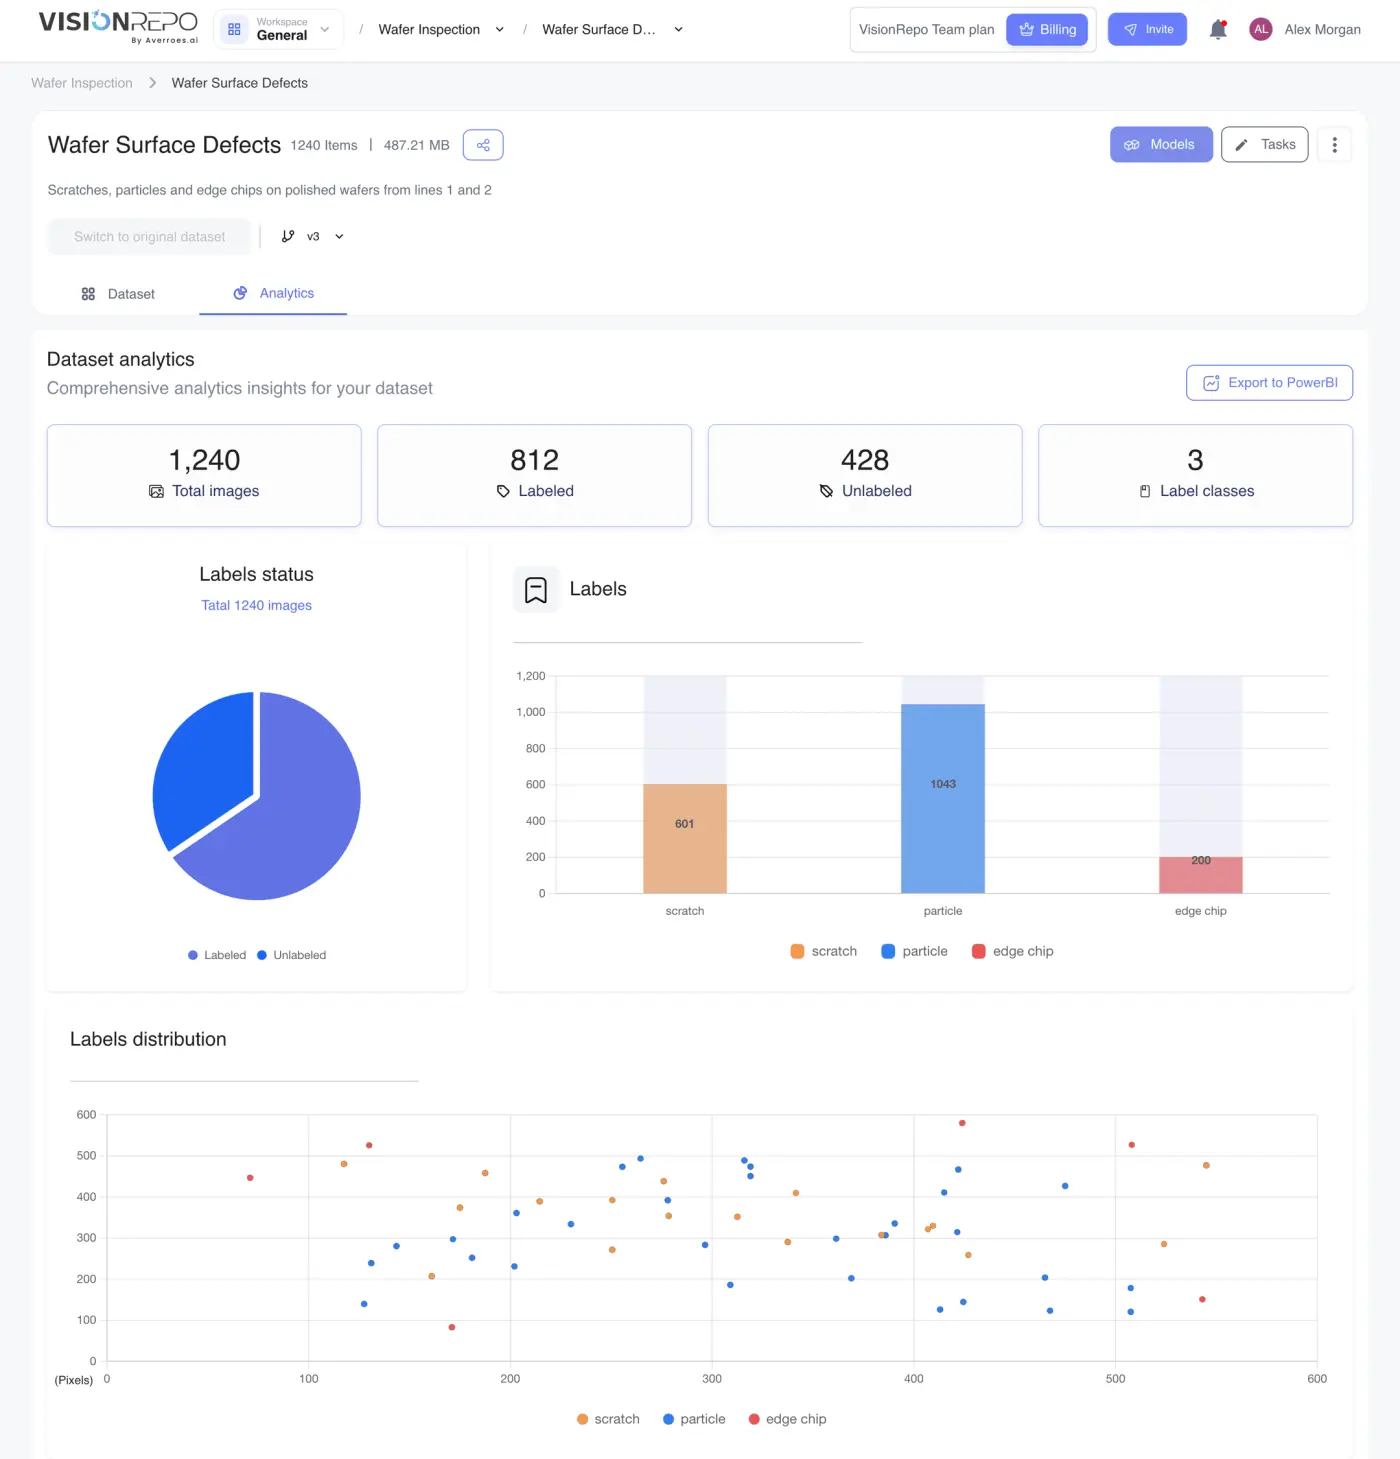
The charts follow the folder you're in and the filters set on the Dataset tab. Filter down to one class or one folder and the numbers describe just that, so check your filters before reading a figure as a total for the whole repository. Each folder card also has its own Analytics button that shows the same charts for that folder in a side panel.
Which charts you see depends on your plan: the distribution chart needs advanced analytics, and the task charts need tasks.
Send analytics to Power BI
Export to PowerBI at the top right of the tab sends the same figures, with your current filters applied, to your Power BI workspace.
- Click Export to PowerBI.
- Read Data Sharing Confirmation, which explains that the data goes to Power BI (Microsoft).
- Click Confirm, or Decline to send nothing.
Each export is a one-off copy; export again to update Power BI. The button needs a plan that includes it.