Solar Results and Reports
Read what a run found, look at each anomaly, download the Critical, Mild and Low reports, and automate runs with the API.
When a run completes, the flight's Overview shows what it found, and three PDF reports list the anomalies by severity: Critical, Mild and Low. The run decides each anomaly's severity.
Read the results
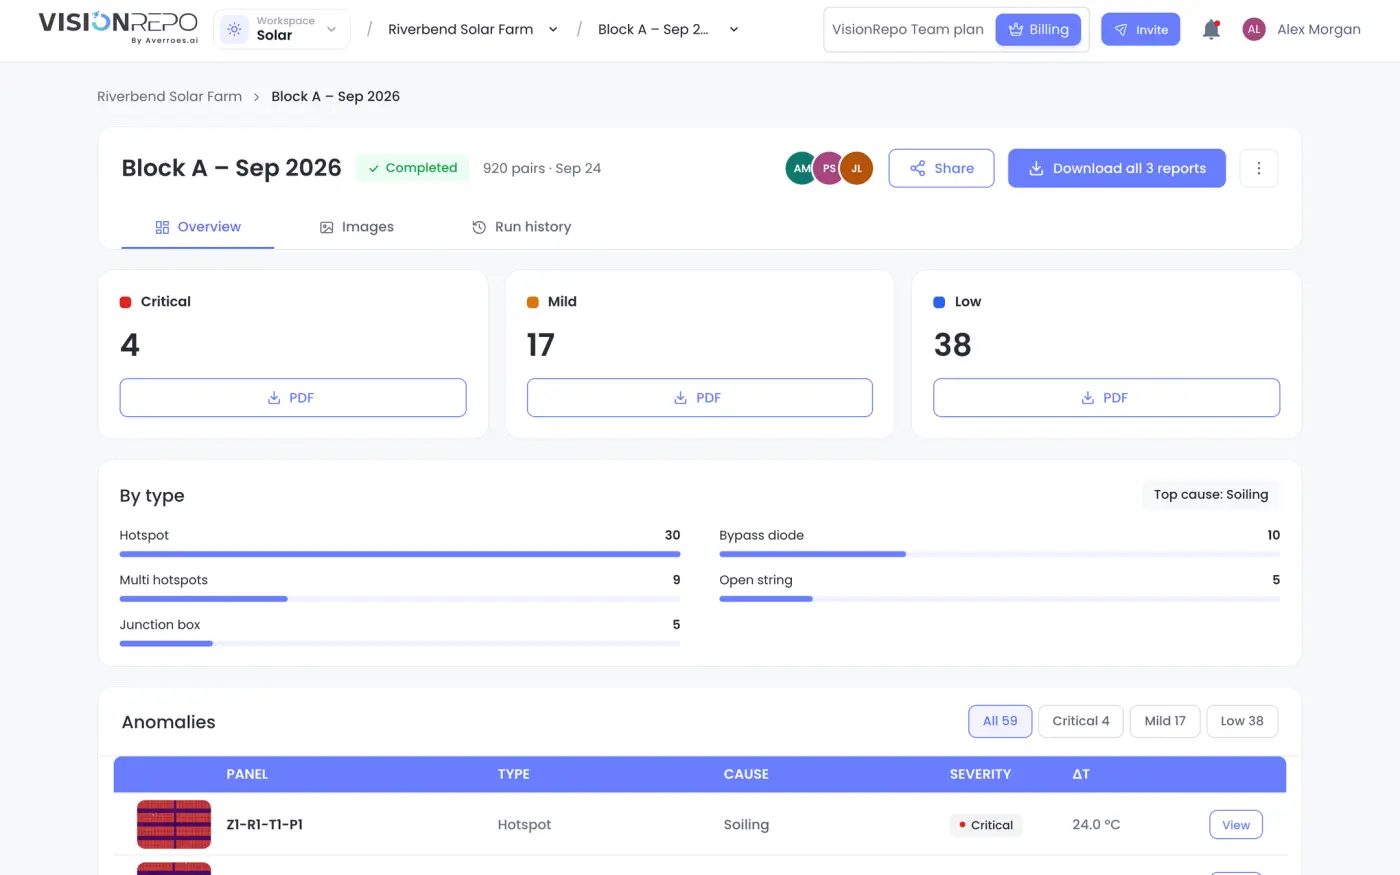
- The three severity cards count the anomalies, and PDF opens that severity's report.
- By type counts the anomalies of each type, with the most common cause beside it.
- Anomalies lists every one, critical first, with its panel, type, cause, severity and temperature difference (ΔT). Filter it with All, Critical, Mild and Low, and click View to look at one.
If the run couldn't use every pair, a yellow note says how many it covered, for example Results cover 901 of 920 pairs, and why: photos that couldn't be analysed, or pairs whose thermal and RGB photos couldn't be lined up. Their defects have no panel number. Show the N lists those pairs on the Images tab.
Look at an anomaly
Click View on an anomaly, or a photo on the Anomalies filter of the Images tab. The viewer opens on that anomaly.
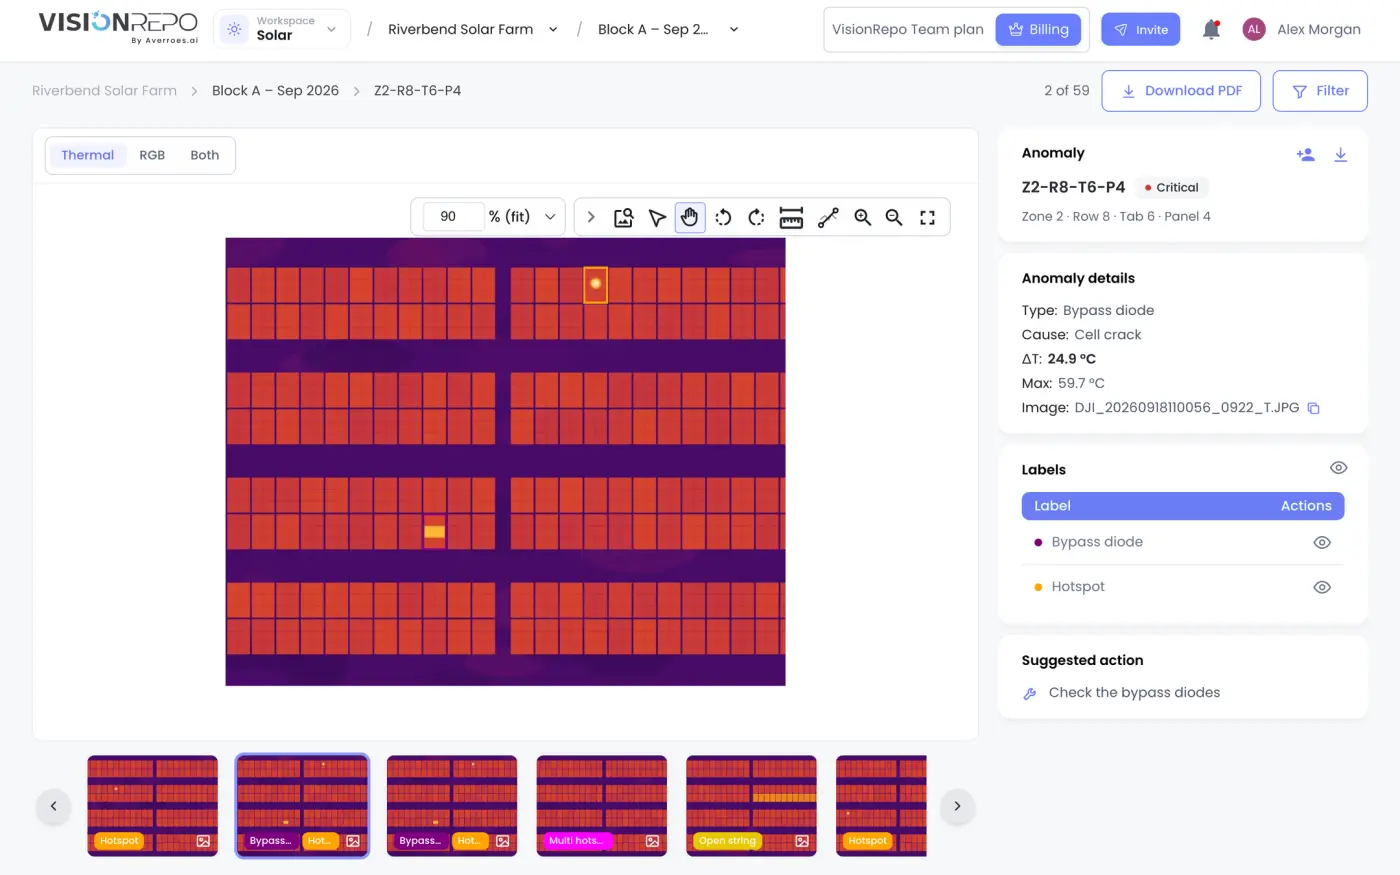
- Thermal, RGB and Both switch between the thermal photo, the RGB one, or the two side by side. The anomaly is outlined on the thermal photo.
- The strip underneath lists the anomalies in report order. The arrow keys, or the arrows at either end, move to the previous or next one. Filter shows one severity only.
- On the right, Anomaly gives its panel and severity, Anomaly details its type, cause, temperatures and photo name, Labels the classes on the photo, and Suggested action says what to do about it.
- Download PDF opens the report of the anomaly's severity.
You can zoom and pan, but not change anything. The viewer is read-only.
Download a report
On a completed flight, click Download 3 reports at the top, or PDF on a severity card. Each report opens in a new tab, from where you can save it. The menu shows how many anomalies each one lists and its size.
A severity with no anomalies still gets a report, which says that none were detected. Earlier runs keep their reports: open Run history and click PDFs on a run.
Report links last 24 hours. The app gets a new link for you when the one it holds is about to expire.
Read a report
Every report has the same sections:
| Section | What's in it |
|---|---|
| Cover | The site, the flight date and the client the report was made for |
| Site Information | An overview of the site, the flight period and the site's location |
| System Specifications | The site's report details, plus what was read from the photos |
| High Level Site Plan | The map of the site, the same map with every panel's location code, and a guide to reading the codes |
| Result Analysis | A chart of this report's anomalies by type |
| Anomaly Details | One entry per anomaly (see below) |
| Contact Information | How to reach us |
The location map in the report is small. A link under it downloads a larger version, and that link works for about a week after the report is made.
Each entry in Anomaly Details shows:
- the thermal and RGB photos of the anomaly, side by side;
- its type, cause and severity;
- its zone and panel number, in the format of the site's type (see Solar Sites and Flights);
- the panel's minimum, maximum, mean and delta temperature;
- the weather when the photo was taken: air temperature, humidity, cloud cover, wind and irradiance (GTI);
- a recommended action.
Anomaly types and causes
The anomaly type says what's wrong with the panel. Each type has its own colour in the reports' charts.
| Type | What it usually means |
|---|---|
| Hotspot | One hot spot on a cell |
| Multi hotspots | Several hot spots on the same panel |
| Bypass diode | A third of the panel is hot because a bypass diode is conducting |
| Diode | A diode fault |
| Open string | A whole string runs hot because it isn't connected |
| Reverse polarity | A panel or string wired the wrong way round |
| Junction box | The junction box is overheating |
| PID | Potential-induced degradation |
The cause says what the RGB photo shows on that panel, and the recommended action follows from it:
| Cause | Recommended action |
|---|---|
| Shadowing | Find what casts the shadow and remove it if you can. If not, consider optimizers on the affected panels |
| Bird poop | Clean the panel |
| Soiling | Inspect and clean the panel, measure its electrical output, and keep an eye on it |
| Vegetation | Trim the vegetation and schedule regular vegetation management |
| Unknown | Inspect and clean the panel, measure its electrical output, and keep an eye on it |
Share results
Click Share at the top of a flight. In Share flight, choose people from your organization, or invite someone from outside it, and decide whether each one can view or also edit. The avatars beside Share show who already has access.
Everyone you share a flight with sees its results, viewer and reports. To be told about the site's next runs, they turn on Notify me on the site's page (see Solar Runs).
Automate runs with the API
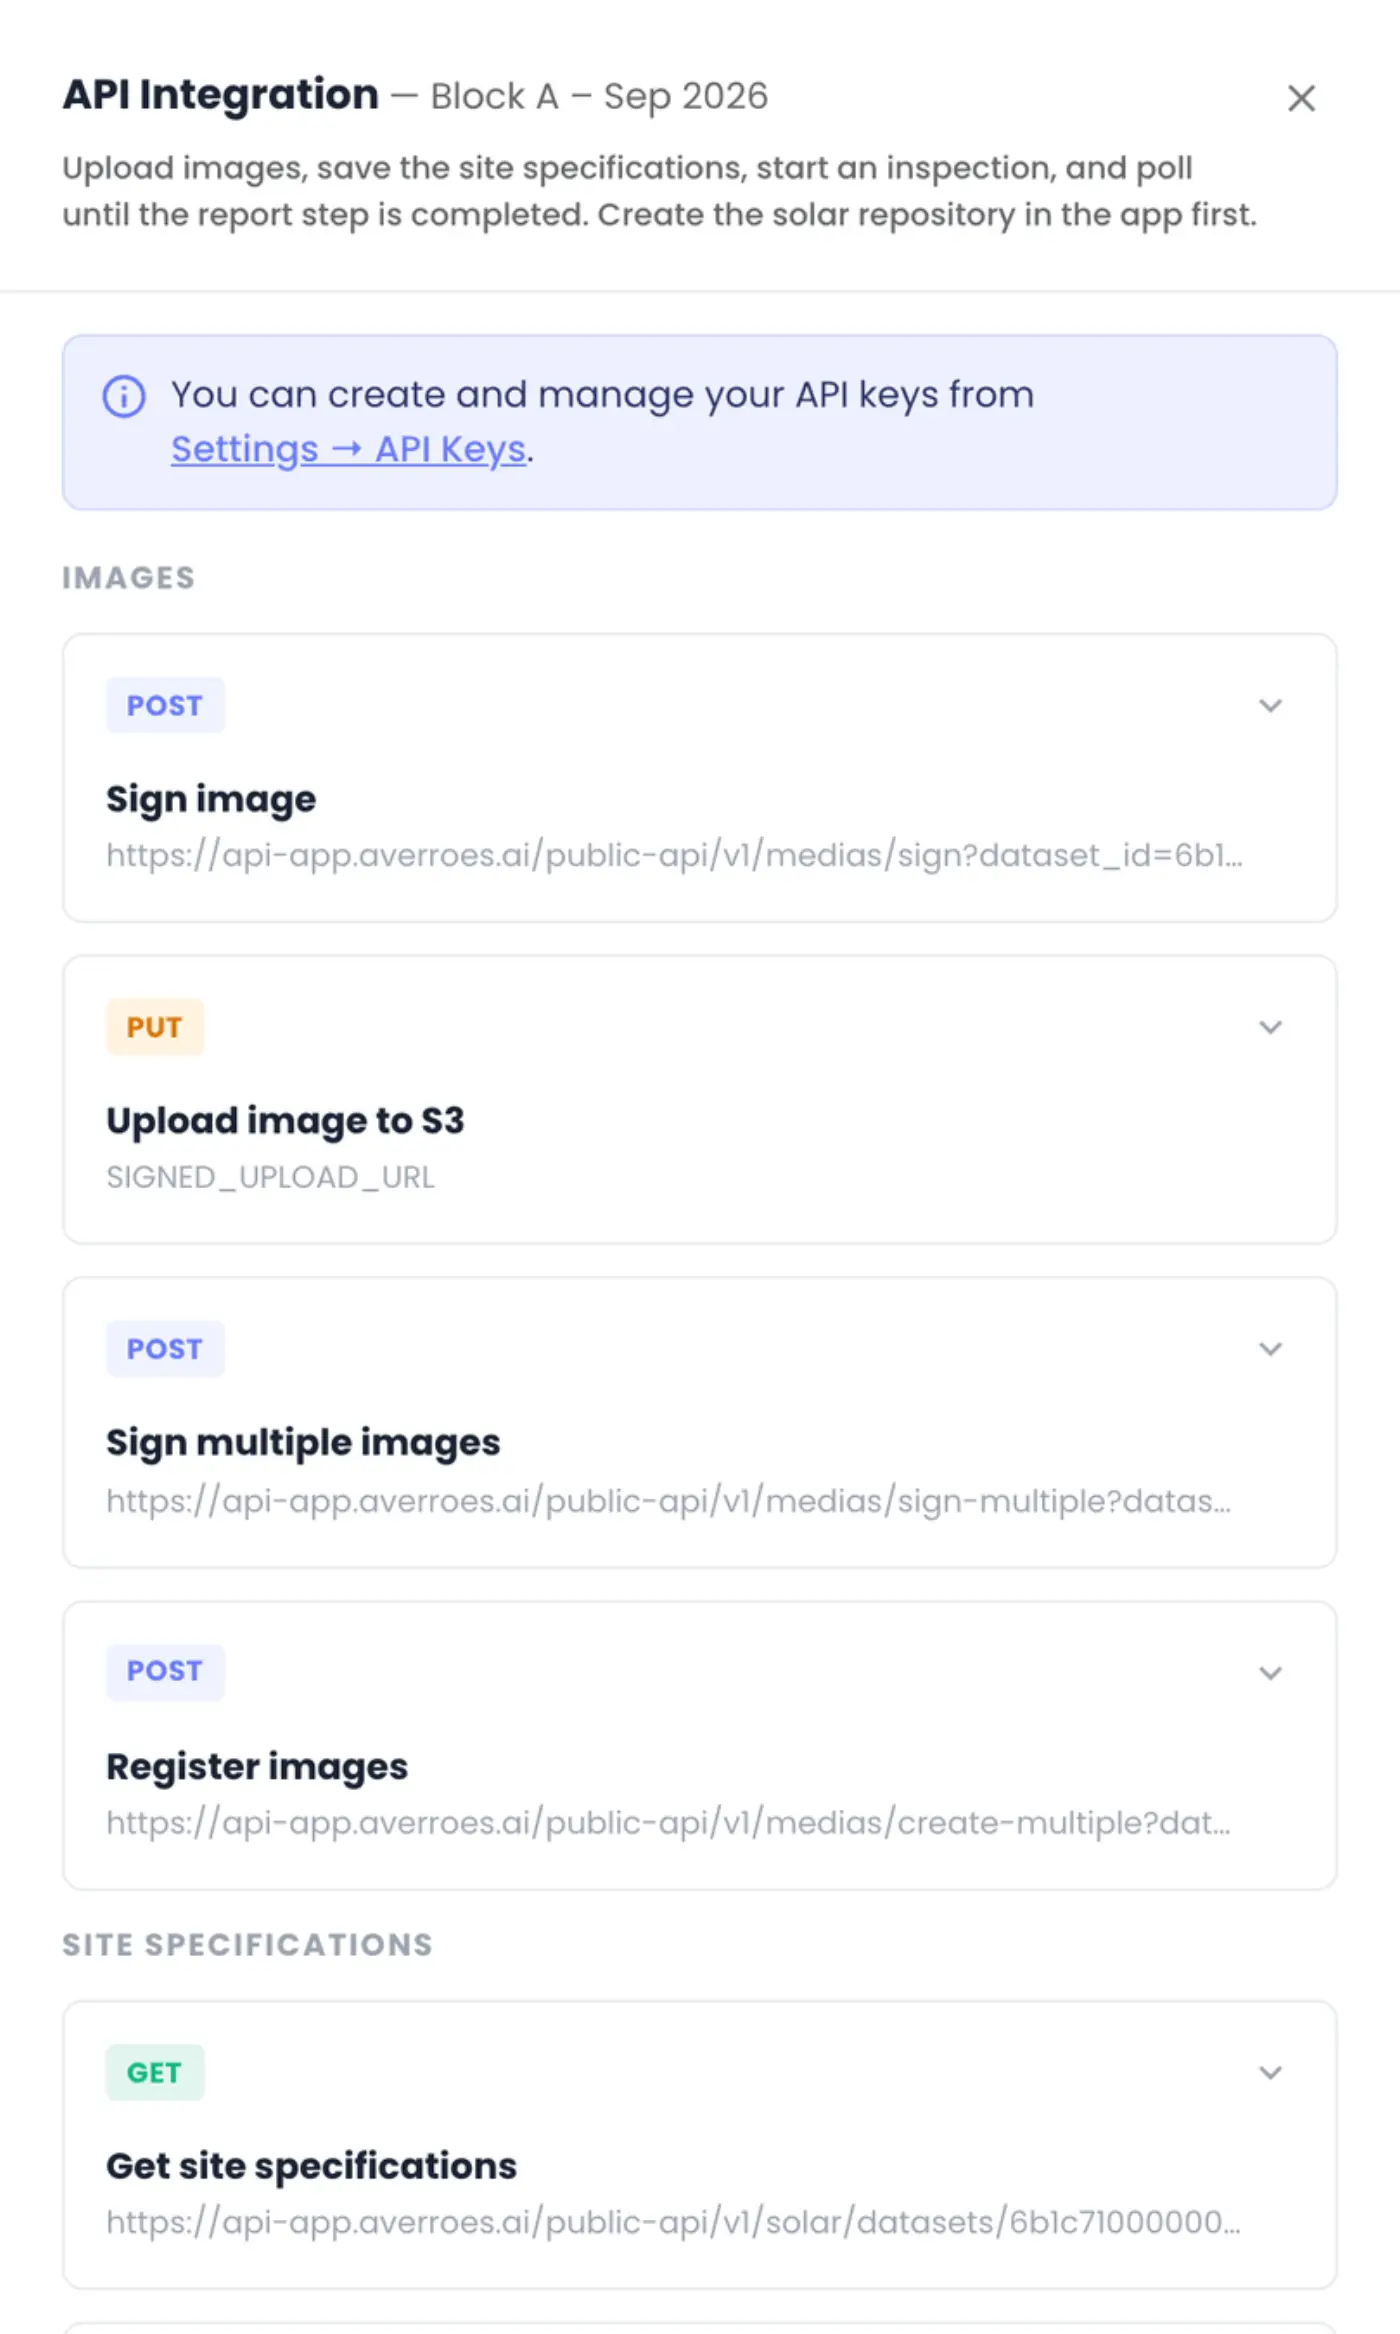
To run flights from your own systems, for example straight after a drone lands, open the flight's ⋮ menu and choose API integration. The panel lists the requests to make, in order, with cURL, Node and Python examples filled in with this flight's identifiers:
- Images: sign and upload the drone photos, then register them with the flight.
- Site specifications: read or save the report details.
- Inspections: start a run, list the flight's runs, and retry a failed one.
The rules are the same as in the app: a run needs complete thermal and RGB pairs, only one run can be going per flight, and only the latest failed run can be retried. Check a run's status every 30 to 60 seconds until its report step is completed, then download the reports from the links in the response. Those links expire, as they do in the app.
Create the site and the flight in the app first. You need an API key and secret to call the requests (see API Keys and API Docs).